

What is the new Developer Debug Log in WPeMatico and how does it work?
WPeMatico now includes a tool designed specifically for developers: a custom debug log that allows you to save messages in real-time from any part of your code. This feature is completely independent from campaign logs and is intended to help you track events or run tests during the development of plugins or custom integrations.
You can enable Debug Mode by going to WPeMatico > Tools > System Status > Danger Zone. Once enabled, the system will start recording all messages sent through the wpematico_log() function.
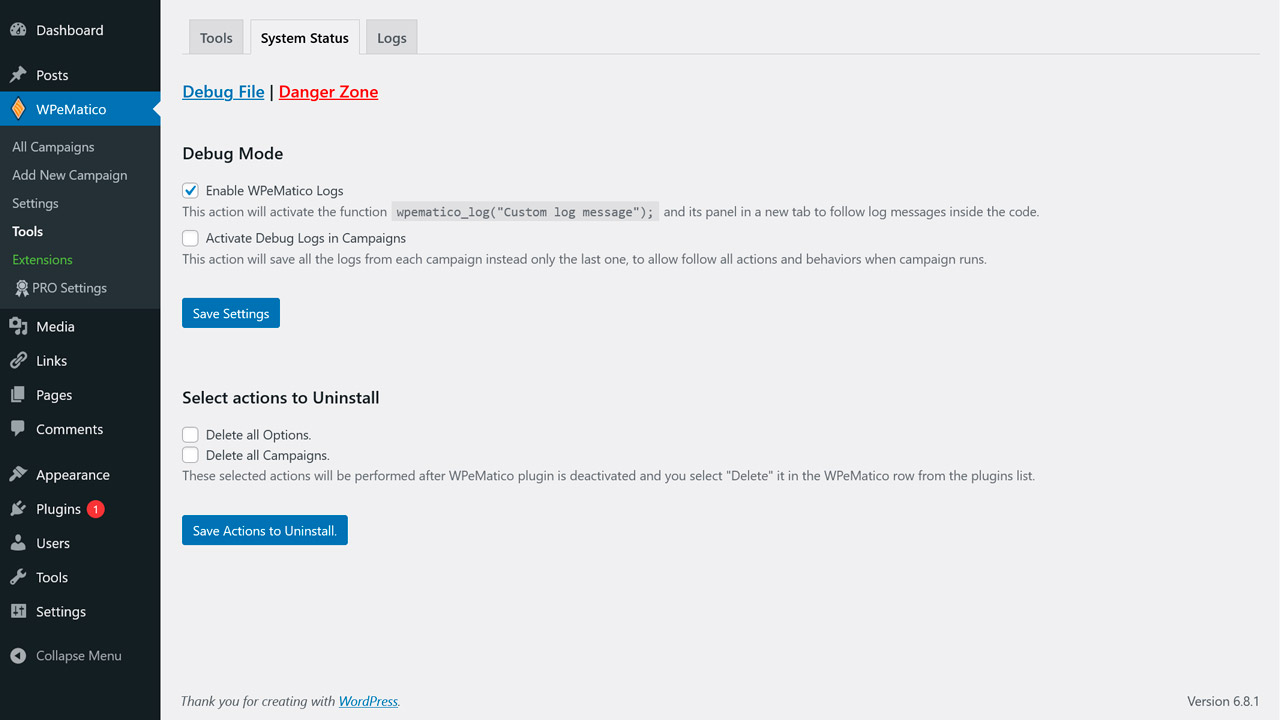
To add a line to the log, simply use the following function anywhere in your code:
wpematico_log( 'This is a custom debug message.' );
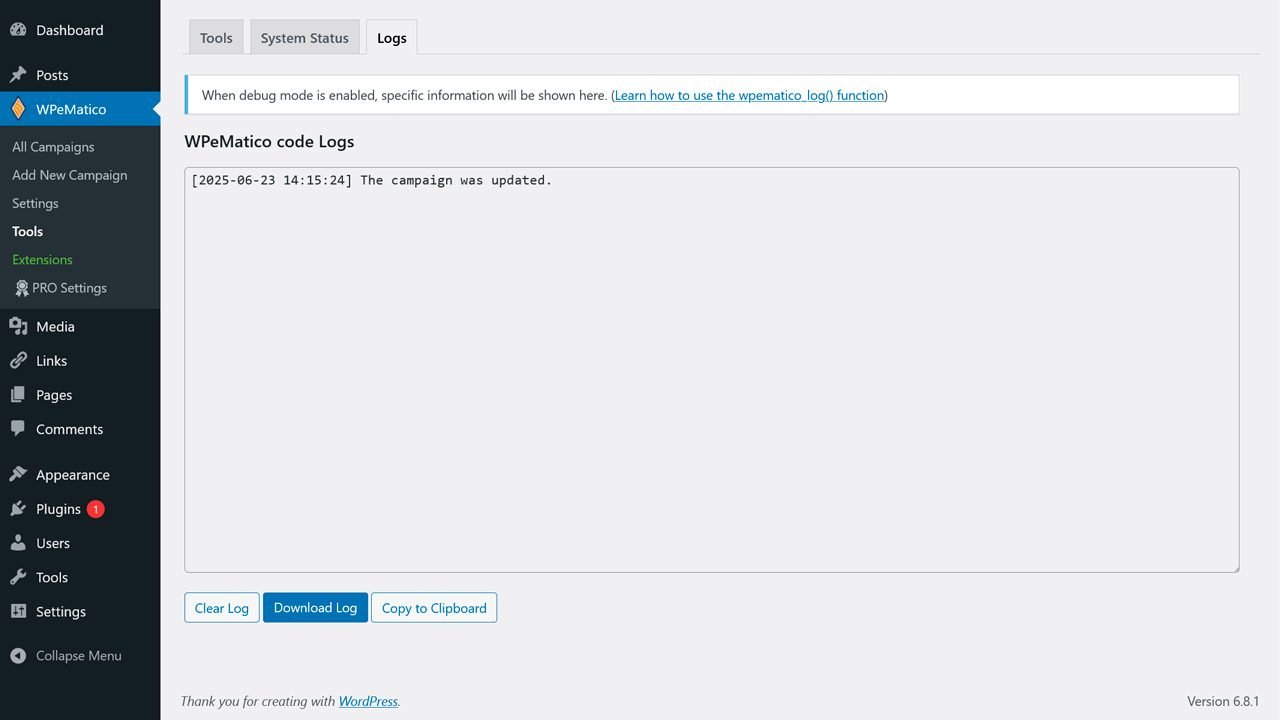
This function call can be made from any part of your WordPress site, including your own plugins or custom functions. Each message will be logged with a timestamp in a new line in the log file.
Note: This function will only have effect if Debug Mode is enabled in the tools screen.
The log file is stored in a secure location within your WordPress filesystem. It is not accessible via URL, ensuring that sensitive information cannot be exposed through the browser.
From the same Debug Log section, you will be able to:
- Download the current log file to review or share it.
- Clear the log manually to start a fresh debugging session.
No. This debugging system is independent from campaign logs. While campaign logs are configured per campaign and focus on automated fetching and publishing processes, the Developer Debug Log is meant to record custom messages that you define in your code.
This tool is ideal for:
- Debugging custom functions during the development of WPeMatico add-ons or third-party integrations.
- Logging key events or data triggered through hooks or filters.
- Temporarily tracking processes without mixing them into campaign logs.


